
Humor me with this:
A bat and a ball cost $1.10 in total. The bat costs $1.00 more than the ball. How much does the ball cost?
If you answered, $0.10, you’d be surprised to find that it’s wrong. Seriously, do the (simple) math. The reality is that a majority of people get that question wrong.
Most people focus on the initial instinctual and emotional reaction to numbers, which may not always be the most appropriate response.
So what does that have to do with the Government and you? Well, it appears that this tax season, the Government may have employed the same tactics to get a reaction out of you.
For the earlybirds, you may have noticed that in your Notice of Assessment this year, the Australian Government has included a thank you note which includes a category breakdown of exactly where your tax dollars are spent (The ATO told me everyone will get this). See here:
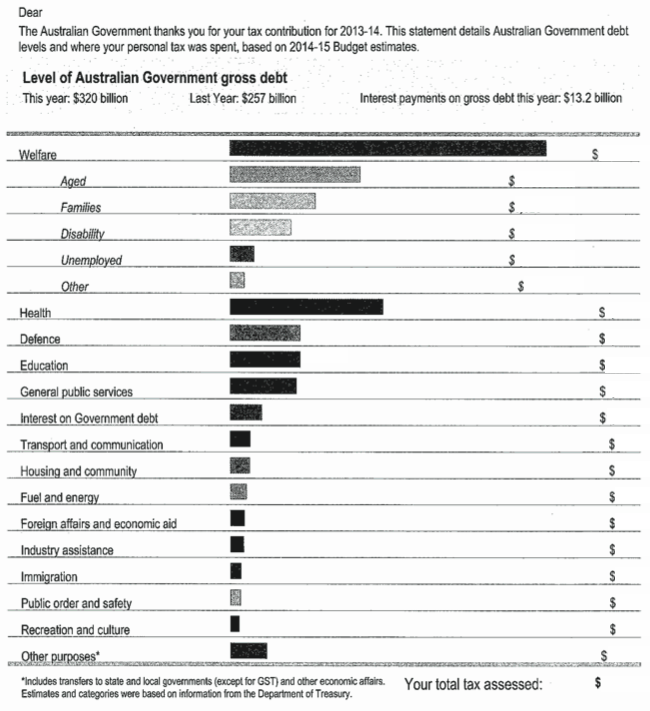
At first glance, you’d be impressed the transparency that the Government is finally providing you. But if you take a closer look, you’ll notice the headline:
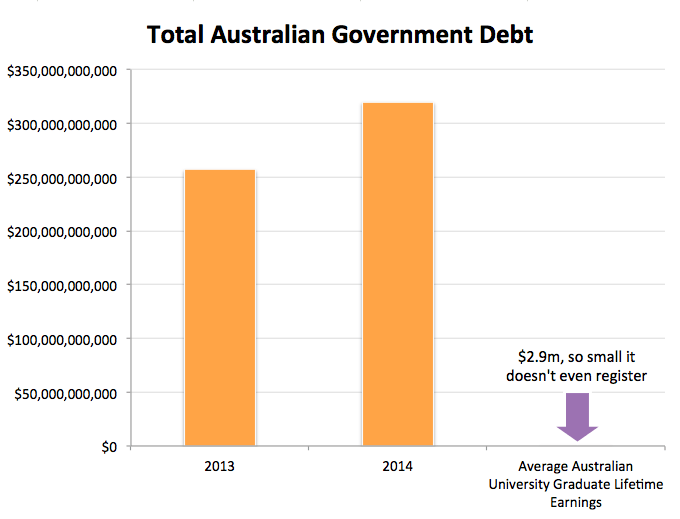
Feeling angry yet? What a horrible job the previous Labor Government has done to put us in this massive hole. A hole which starts at an astronomical $257 billion and ballooned to $320 billion in the past year. A hole which, even with the best efforts of Tony Abbot and Joe Hockey, sank a further $63 billion. $63 billion is a huge number.
$63 billion is exactly how much we, as a nation, spent running all of our cars last year.
When you reflect on these numbers and compare it to how much you could earn in your lifetime, you’d feel oh so small. And that is exactly how the Government wants you to react.
Is there really a debt crisis?
First of all, there’s no question that our national debt has risen over the course of the Rudd/Gillard Labor Government. Over the last 6 years, our debt has more than quintupled, from $60 billion in 2008/09 to over $300 billion today. This is a real number! The Government isn’t making anything up.
But its by no means on the verge of being unserviceable – a point which the Government has been touting ever since the election campaign.
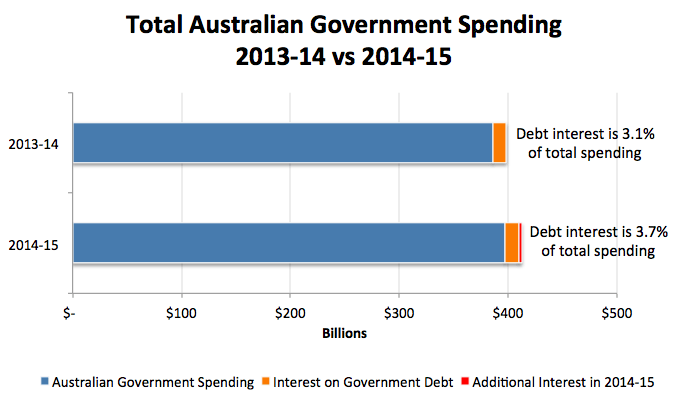
Firstly, in line with the increases in total debt, the interest we’re paying on it has increased year by year. The $13.2 billion presented is also a real number. However, $13.2 billion in the context of over $400 billion of total Government spending is only around 3.7%. Further, when compared to the previous year, when our debt was at a more modest $257 billion, our proportional spending on interest debt has only gone up a little over 0.5%. If you pay $40,000 in tax a year (around $130k household salary), this is around $200. Or $3.85 a week.
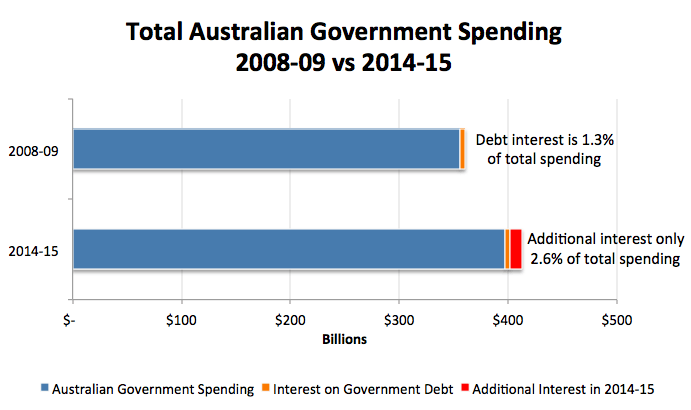
Then, let’s assume for a second that the Rudd/Gillard Government had been utterly horrible, and compare the 2008/09 results to 2014/15. The additional interest we pay now, compared to 2008 contributes to 2.6% of total Government spending.
So again, if you’re paying $40,000 a year in tax, interest payments has gone from $480 in 2008 to now $1,480 in 2014. An increase of $1,000 or so, or around 0.75% of your taxable income. (As a comparison, the Medicare levy is at 2% of your taxable income)
So while claims of economic mismanagement may have some validity, it’s certainly not as dire as the Government will have you believe.
So is this debt stat the most important thing to highlight?
We concluded that the extra debt isn’t going to break the bank… for now. But is it the most important issue in the tax spending breakdown? In other words, is our increased spending on interest today way off the charts when compared to other categories of Government spending – as the Abbott Government seemingly would have you believe.
I decided to investigate first, comparing this to the first Rudd / Gillard budget (2008/09). I’ve CPI indexed these numbers as well as factor in our population growth over the 6 year period to present a per capita comparison.
| Category of spending | Per capita spending 08/09 (CPI indexed) | Per capita spending 14/15 | Change in spending |
|---|---|---|---|
| Health | $2,377 | $2,841 | $464 |
| Interest on Government Debt | $191 | $561 | $369 |
| Welfare | $5,925 | $6,192 | $267 |
| General Public Services | $579 | $717 | $138 |
| Immigration | $62 | $177 | $115 |
| Defence | $930 | $1,028 | $98 |
| Education | $1,192 | $1,255 | $64 |
What we see here is that based on this, the greatest increase in spending isn’t interest, but health. With welfare, general public service and immigration immediately thereafter. So the nominal increase in dollars allocated to interest payments isn’t that far off the increases of the other spending categories.
But what about percentage increases. Surely, this is where the claim of poor management can be concluded.
| Category of spending | % difference- per capita spending 08/09 vs 14/15 |
|---|---|
| Interest on Government Debt | 193% |
| Immigration | 187% |
| General Public Services | 24% |
| Health | 20% |
| Foreign Affairs and Economic Aid | 16% |
So looking at this, indeed the greatest percentage increase is in invest on Government debt. However, spending on immigration closely follows this, with other spending way behind.
While you can claim that other spending categories here perhaps are more “useful” (ie interest payments isn’t a public service), the actual necessity of taking or prior debt to stimulate the economy is a longer discussion.
The point of this analysis is rather to show, how overreaching the Government perhaps has been, in putting the spotlight on the debt situation alone.
So I might still be outraged
That said, the findings here do raise more questions.
- I’d like to know in layman’s terms about how the Government’s plans on reducing the debt.
- I’d like to know more about the other categories where the spending has increased, what are the underlying programs and policies?
- I’d like to know more about how we compare to countries like us. Is spending over 50% on welfare and health a good thing?
Give me another week, and I’m sure I’d have a few more.
In it’s current form, the data simply sensationalises the debt problem and elicits an emotional response from each taxpayer. Rather than constructively start a dialogue.
For my money, blatantly putting fear through the hearts of Aussies can’t be a good idea… or can it?
Perhaps it’s well played Mr Hockey after all.
Data sources:
- ABS 3101.0 Australian Demographic Statistics link
- Budget 2014-15 link
- Parliament of Australia: Historical Australian Government Spending link

Awesome article, Bosco!
Great Article. Finally someone is talking about the debt issue in simple language.
Can someone please explain why the answer isn’t $0.10?
Hi Peter, if the ball costs $0.10 and the bat costs $1 more than the ball, that means the bat is $1.10. The total would then be $1.20, not $1.10.
The right answer for the cost of the ball is $0.05. The bat costs $1.05 and the total is $1.10.
Hope that helps.
@Peter
BAT + BALL = $1.10
and
BAT = (BALL + $1.00)
substitute the right hand-side of the 2nd equation into the first equation and you get
(BALL + $1.00) + BALL = $1.10
or
2 x BALL = $1.10 – $1.00
so
BALL = 10c / 2
= 5c